In 2018, I decided to start keeping track of the video games I had played. I believe I did this because my memory was faulty. Someone would ask me about a game, and I’d remember that I’d played it, but be unable to remember much about it. In other cases, I’d remember liking it, but not much beyond that.
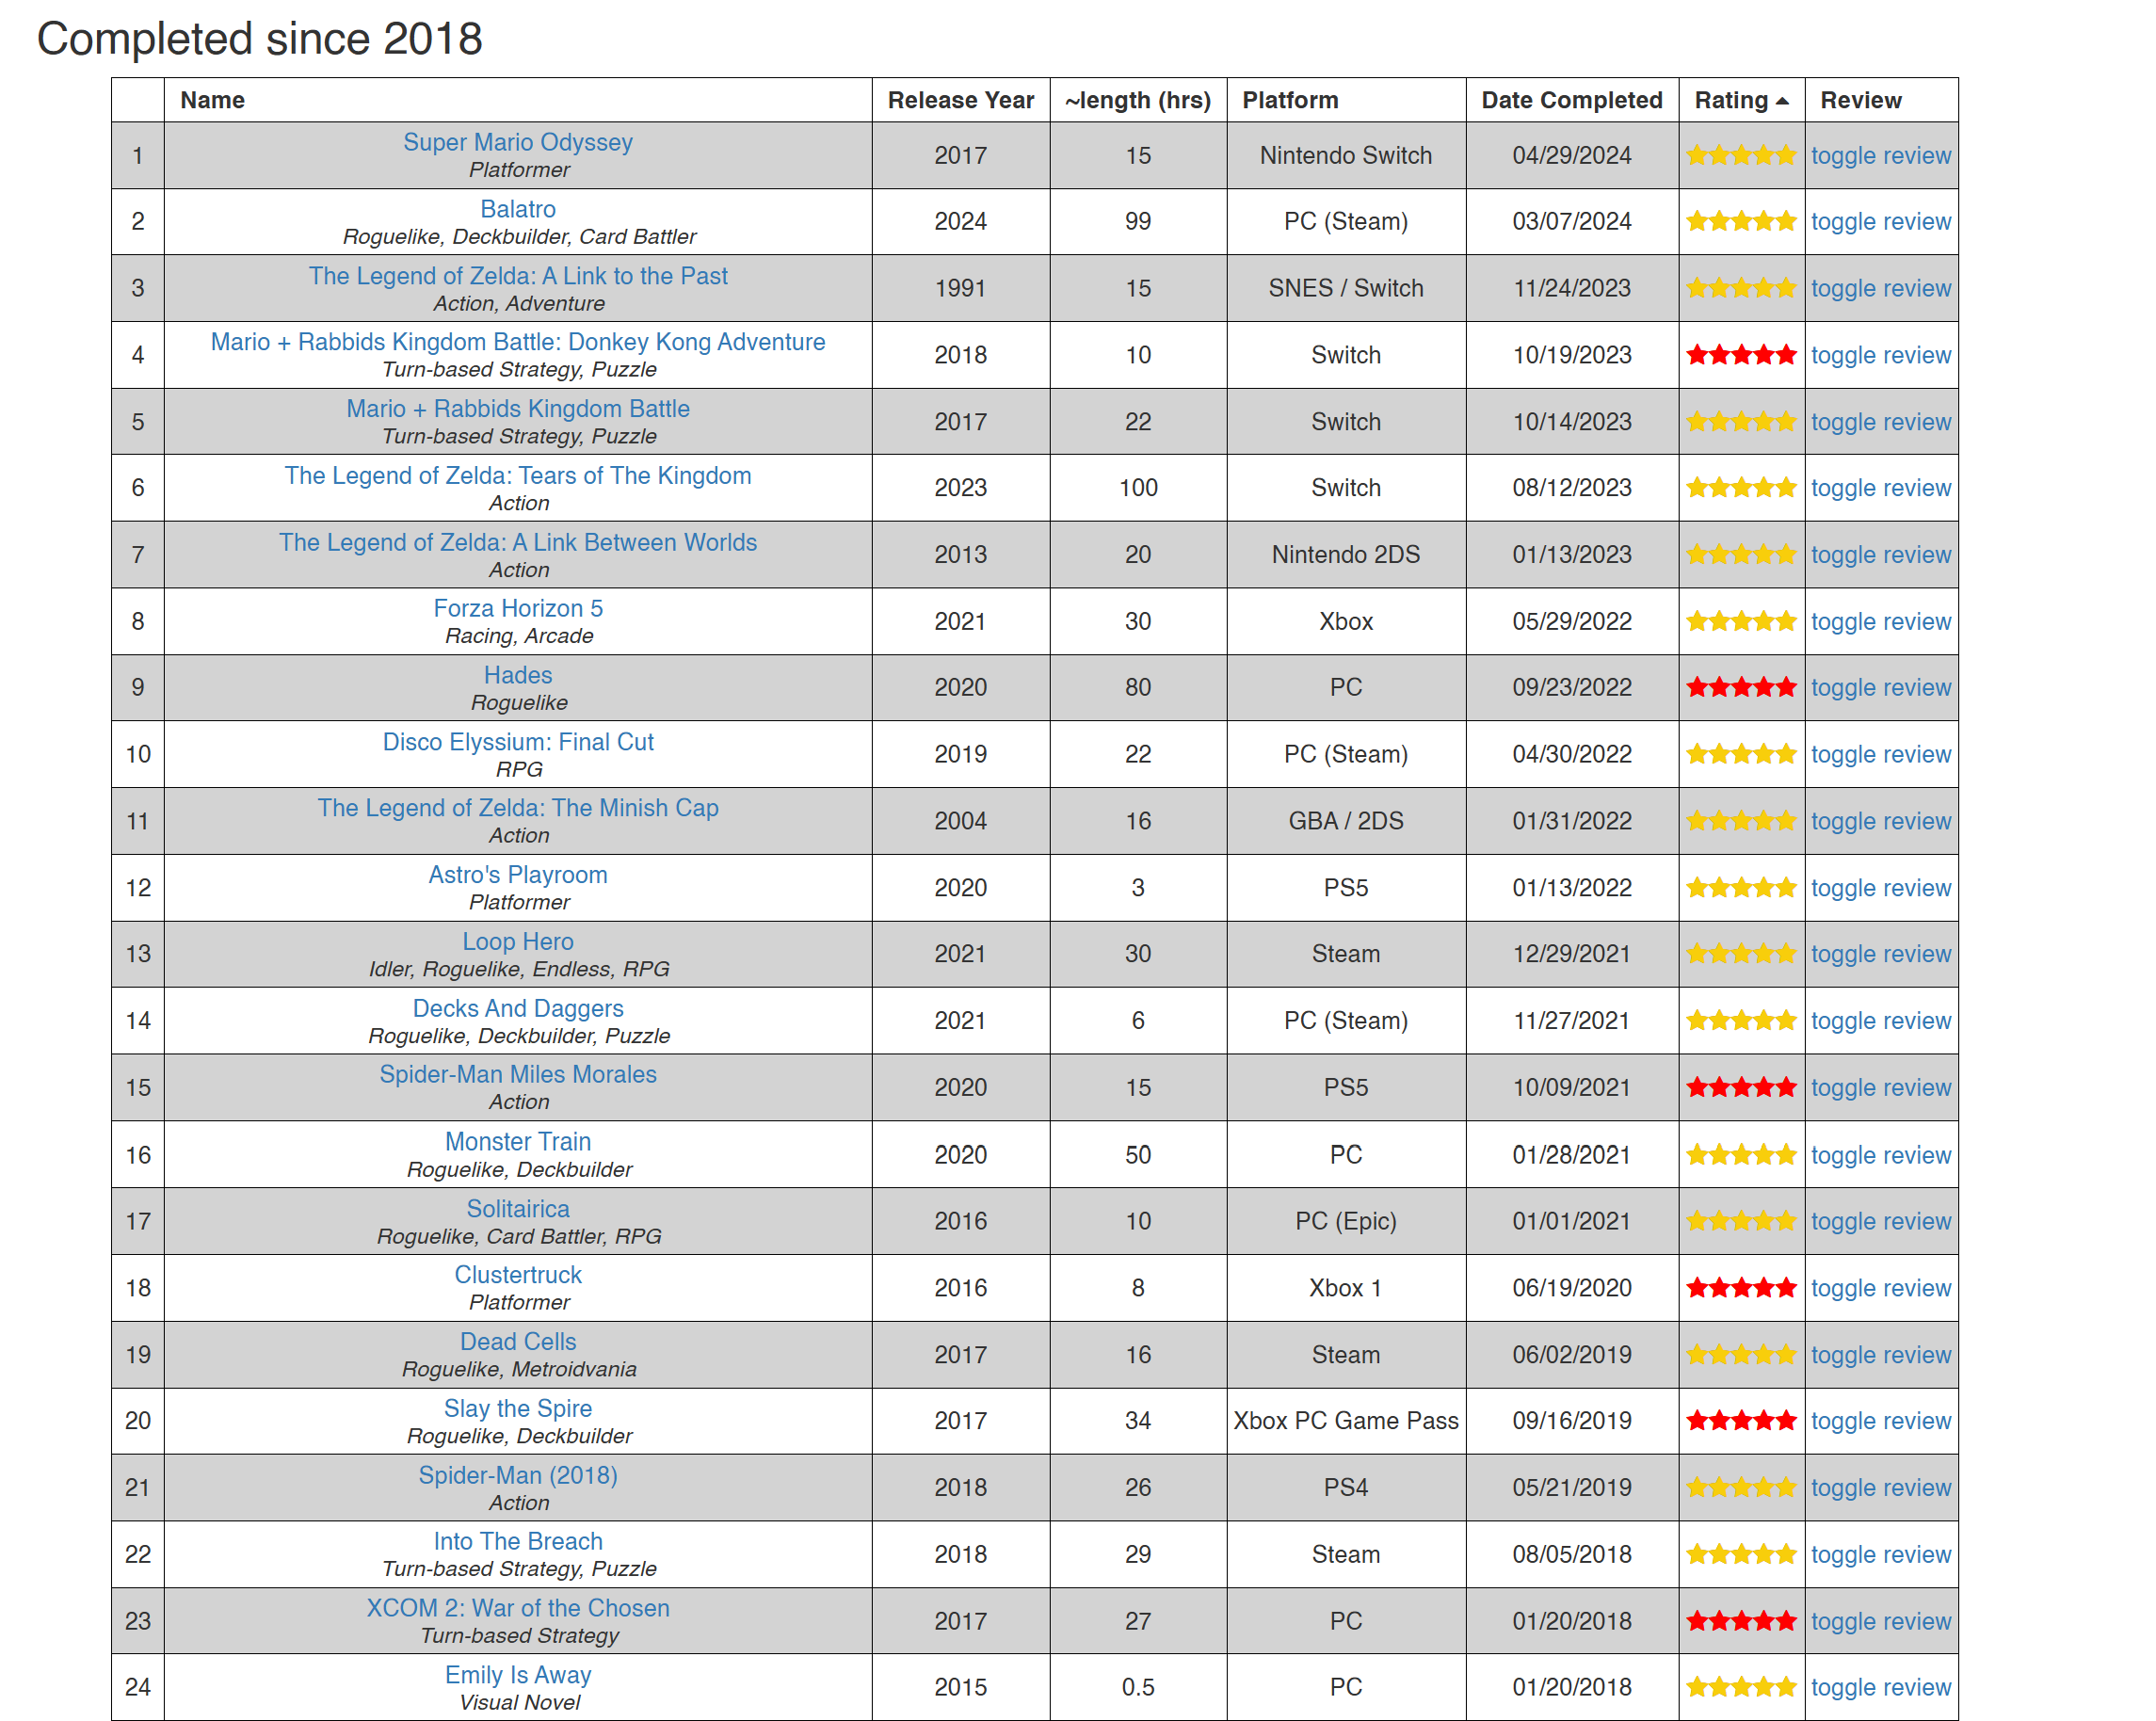
In the six years I’ve been keeping track, I’ve played over 100 games. Recently, I was trying to figure out if I would enjoy a game (Armored Core 6). I decided to share some of my favorite and least favorite games that I’ve played recently, as a benchmark. Turns out there’s a LOT more games I like than dislike!

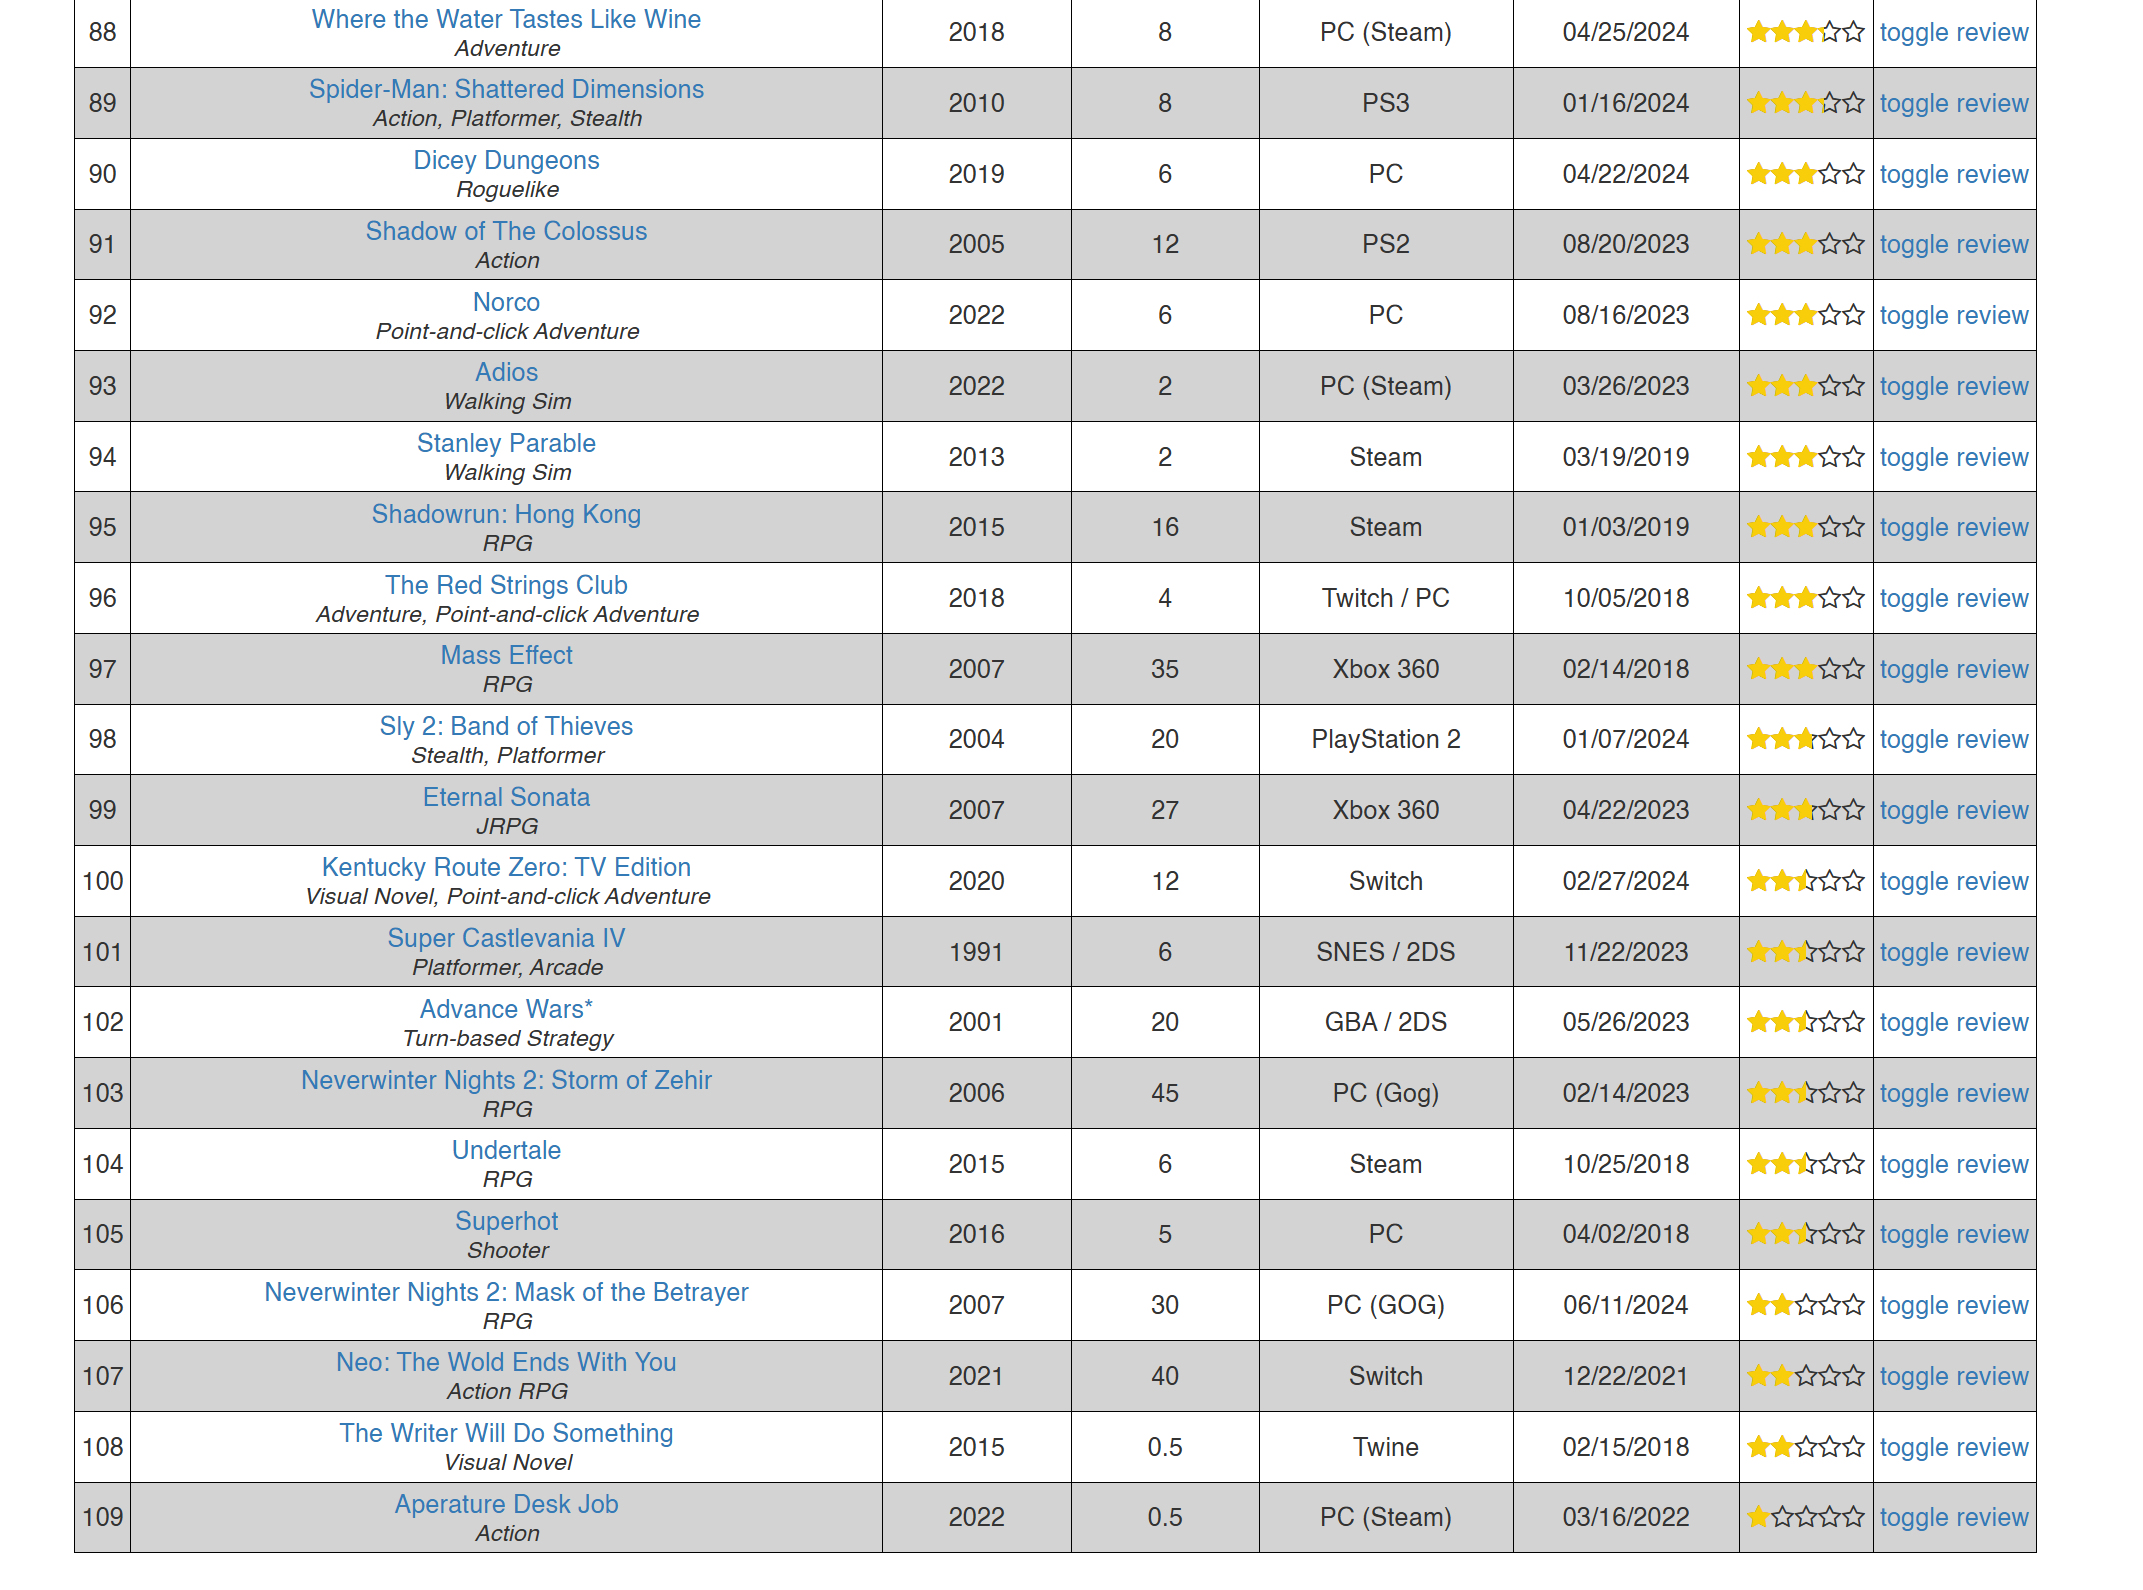
Since 2018, I’ve played 24 games that I’ve rated 5/5. Compare that to the bottom of the same chart:

This made me realize that it would be interesting to see a histogram of what my ratings look. I expected the graph to look something like this:

I knew there were a lot of 5 star games, and I also knew that I was a bit of a soft touch. I started doing this for my own benefit, and 5/5 means “I had a good time”. So I was a bit surprised to see the actual data looked like this:

The biggest surprise for me was how many games I’d rated 4/5!
WHYYYYYY?????
There are three major reasons why the data looks like this (and why I expected it to look even more like the right side of a bell chart).
- Self-selected data.
I play games I think I’ll like, and the more games I play, the better idea I have of what I’ll like. If I don’t think I’ll like a game, I don’t (often) play it. So we get a lot of high-ranking games
2. Skewed data set
This isn’t a graph of every game I’ve played, it’s a graph of every game I’ve finished. I don’t put down games often (usually 0–2 per year). But I do put them down! If there’sa game I’m not enjoying, especially if it’s a long game, I don’t put it in here. Arguably, Dicey Dungeons shouldn’t make this list. I used my definition of ‘finished’ for endless games (I’ve seen what the game has to offer), but I’ve been told that there’s a bit more of a story if you churn through the rest.
Games that I really would not have enjoyed if I’d continued to play (Bully, Ghostbusters) aren’t on this list! And so the data skews upwards.
3. Changes in methodology.
When I started keeping track of this data, I was doing it for myself. Many times my early reviews are just a few lines. Now, sometimes I write thousands of words about Eternal Sonata.
I only started doing 0.25 increments this year, when I really couldn’t decide how to rate the second Sly Cooper game. (I settled on 2.75).
I’m not that interested in differentiating between a 4.5 and a 5, and even less interested in distinguishing between a 4 and 4.25.
A few of these games I rated highly I don’t even remember! Datawing? Decks and Daggers? I liked ‘em at the time! I especially enjoyed the bit with the frog, I wrote three years ago. It couldn’t have left less of an impression.
So yeah, I’ve gotten more precise over the years, and I’m still soft.
What’s the point, man?
There’s no big takeaway here. I give most games a 4/5. I give out a lot of 5s and a big chunk of 4.5s. I’m an easy grader, and I play what I like. Probably this means I should be more granular, especially at the top end.
But really, if I give a game a good rating, it means I had a good time with it, and you might too. Maybe I’ve obfuscated this signal a bit too much! “Alex gave this game a 5/5, but he also gave a 5/5 to this other game that I thought was a 4 at best.
Hopefully, that’s where the words of my review come in. I’m willing to overlook a lot for a game I enjoy, but I try to call it out.
We are, after all, different people.