
Last time, I explained how there are ten tiers of spreadsheet mastery, and that by conquering each of them you unlock a new level of proficiency. The first 5 are competency, while these five bring you into expertise.
6. Conditionals
Sometimes you want different things depending on what’s in the cell. Excel has the if() formula, which allows you to declare a condition, what to do if it’s met, and what to do if it’s not met.
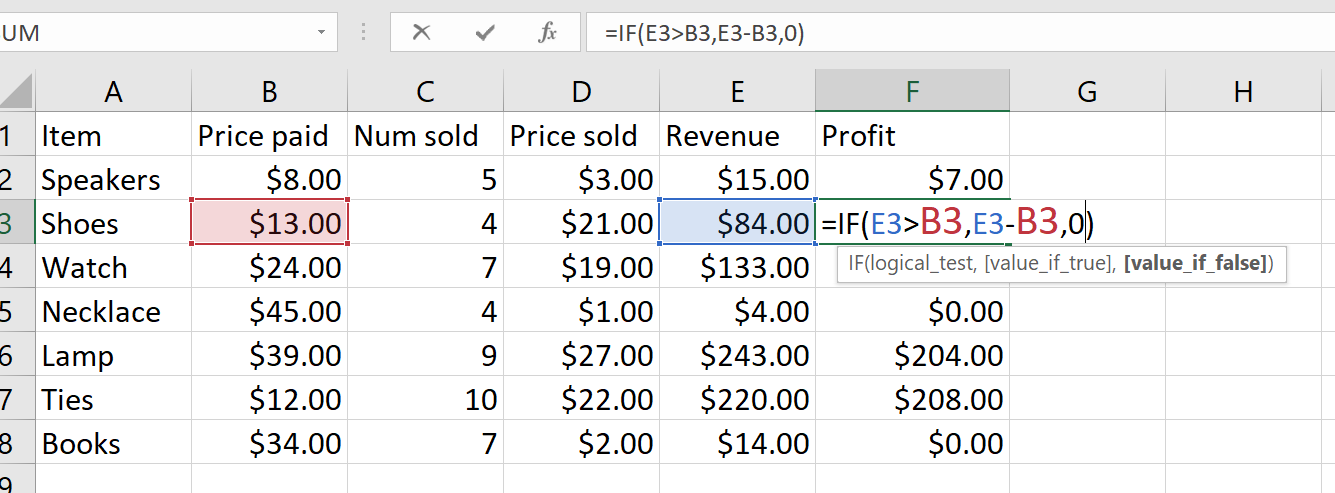
For example, suppose I bought a bunch of junk and am now selling it. I want to see my profit. If the number sold * price is greater than what I paid, show me number sold * price - what I paid. Otherwise, show 0. I don’t want negative numbers here!
=IF(D2*C2>B2,D2*C2-B2,0)
I can make this even clearer if I add an intermediary column showing revenue.
Take conditionals a step further
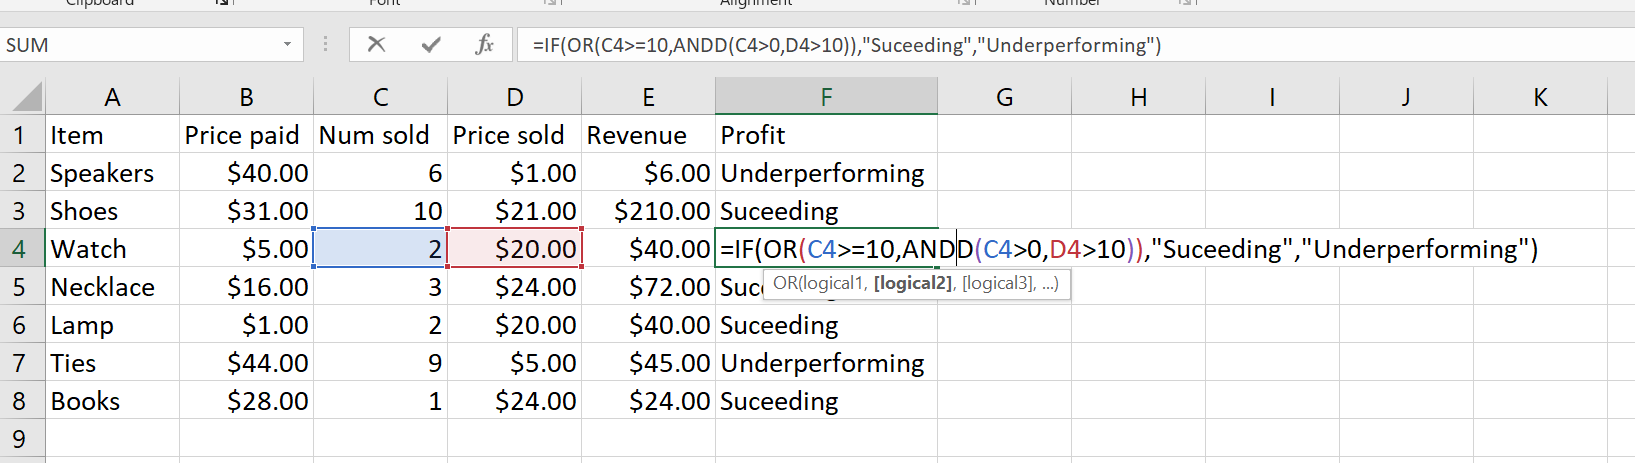
You can use and() and or() to create more complicated conditional formulas. If I’ve sold at least 10 units or if I’ve sold at least one unit for more than $10, write “Succeeding”. Otherwise, write “Underperforrming”.
=IF(OR(C2>=10,AND(C2>0,D2>10)),"Suceeding","Underperforming")
Note that you have to invert the order of “and” and “or” from normal English. This can take some getting used to!
Take conditionals another step further
You can even nest your conditions and chain them together.
If A5 is less than 5, label this Low. Otherwise, if it’s more than 1000, label it High. Anywhere between, label it Medium.
=if (a1<5, "Low", if(a1>1000, "High", "Medium"))
You can see the potential to string these together in even more complex ways!
7. VLookup
Suppose you’ve got a table of data, like showing sales of produce for each quarter. If you want to grab a piece of that data elsewhere, how can you do it?
That’s where VLookup comes in. Vlookup lets you reference data from equations just by knowing how it’s set up.
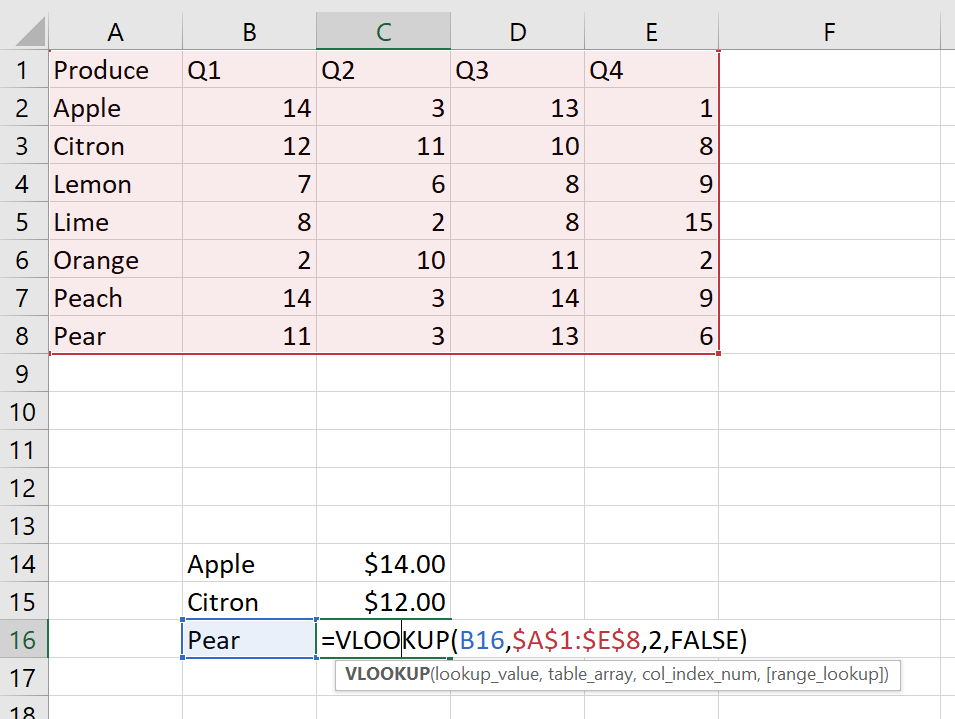
Note: Ensure that your data is either in alphabetic order OR that you provide FALSE as the final argument to VLookup. Otherwise it may not find it at all!
Here’s that quarterly produce example, where I’m just pulling out the Q1 data based on what’s written elsewhere (B14)
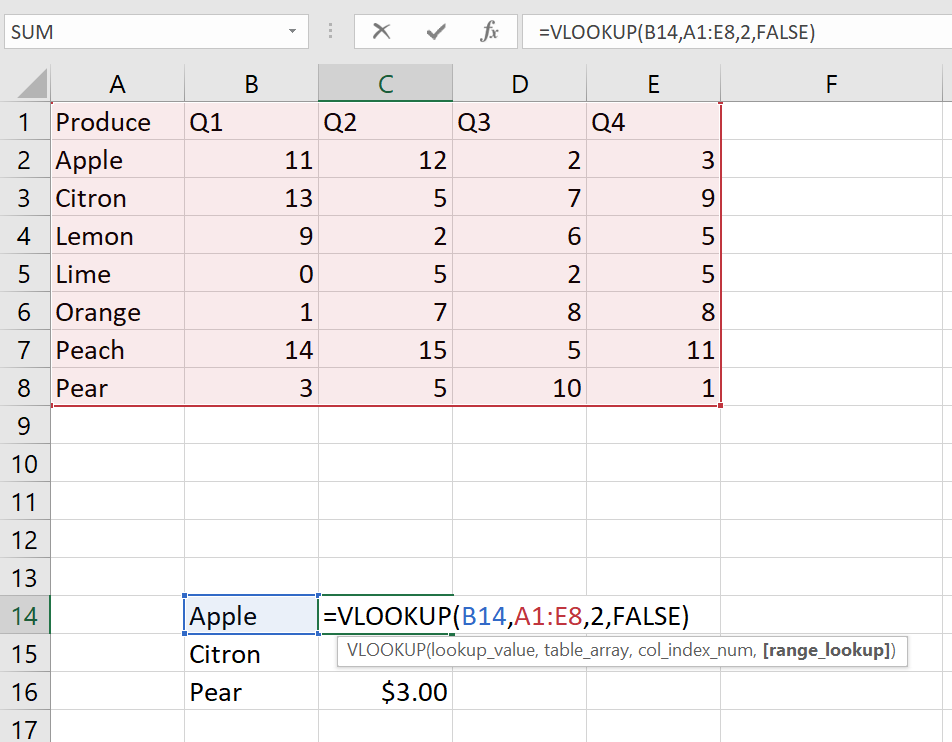
Vlookup is great for pulling data out of structured tables to reference elsewhere!
Take VLookup a step further
It’s possible to do a 2-dimensional VLookup, where both the column and row are varied. This is rather complex, and requires nesting the match() formula within.
8. Dollar sign references
Remember before when we were learning about fill and ctrl+d? Well what if you don’t WANT the references to shift down every time. For example, let’s look at that VLOOKUP example we just did.
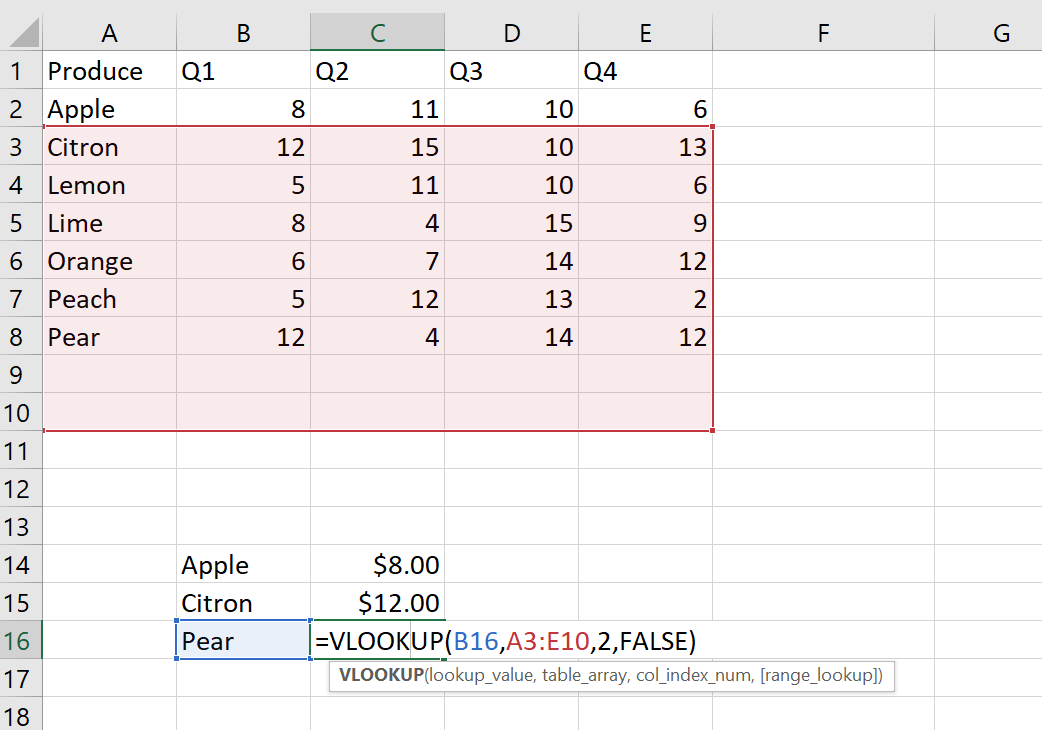
Hey, wait a second! That’s not my table! My table is A1:E8, not A3:E10. It moved it on me!
Fret not, you can tell excel that even when you fill a formula, that it should keep some references static.
How? By using a $.
$A$1 means it will ALWAYS be A1.
$A1 means that the 1 will increase as you fill down, but the A will never change, even if you go to the right.
A$1 is the opposite: 1 won’t change if you fill down, but copying the formula to the right will increase A.
Tip: You can select a cell (or part of an equation!) and hit f4 to cycle through these.
Let’s look at that example from before again, with dollar signs:
Look at that! Even though we dragged the formula down, the range reference remains the same. Thanks, $!
Taking dollar sign references a step further
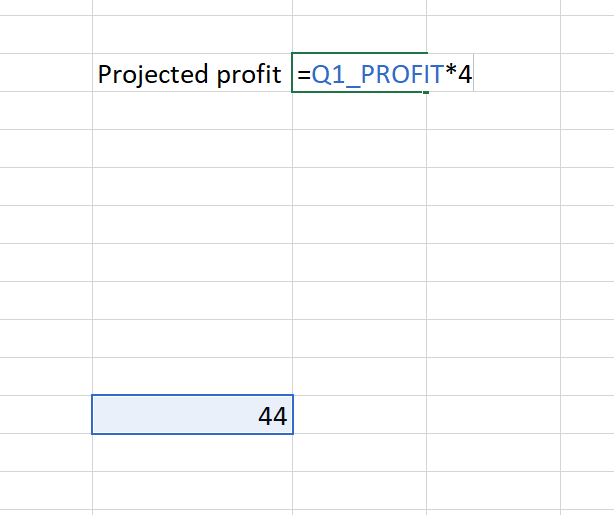
You can actually name cells and ranges! So instead of having to remember that G15 is the total Q1 profit, you can name it Q1_PROFIT and reference it in equations.
Check it out:

You can also name entire ranges or tables, and manage (delete or rename) cells you’ve named.
Tip: You can even give one cell multiple names, so you can refer to it in different ways!
9. Pivot tables
Pivot tables are one of Excel’s silver bullets. They allow you to take a large, complicated set of data and break it down into small, meaningful bits. If you master pivot tables, you’re utilizing a huge portion of Excel’s functionality, and embracing one of its most beloved features.
So what do they do?
Use pivot tables to summarize complicated data or make interactive dashboards.
For example, say you’ve got a sheet representing hundreds or thousands of orders for various products (apples, bananas, cucumbers, eggplants…) and you want to break it down and just answer the question “how much money did I make from each product?”
BAM, pivot table. Simply select a cell within your data, go to insert->tables->PivotTable, and choose your pivots.
It’s a little complicated at first, but there are no shortage of guides and tutorials to get your started.
You can also use pivot tables to summarize or aggregate your data by any field: region, month, produce item, what have you.
Take pivot tables a step further with pivot charts
Pivot charts are automatically-updating charts that reflect data in a pivot table.
Combine multiple pivot tables to make a dashboard showing off whatever key metrics you care about.
10. Automation (VBA or Office Scripts)
This is the big one, the final strate of functionality that separates Excel Power users from the rest. With automation, you can set up tasks to execute on a click of a button that otherwise take manual time.
What kinds of things can you automate?
- Generate a report from data.
Sure, if you’re using pivot charts and dashboards, this might be done for you. But if you’re exporting a report to PowerPoint or Word, this can save you time. - Color-code rows based on the current data, flagging overdue items.
This is another are that can be done with conditional formatting, comparing against thetoday()function. Still, it can be useful to color-code, sort, and hide completed rows all with a click of a button, keeping your data clean and organized. - Create data from a template (or restore a modifiable worksheet to a default template).
Useful for daily reports or worksheets that other people can modify pieces of.
How do I automate?
Excel has two main ways of automation: VBA (Visual Basic for Applications) and Office Scripts.
VBA is older, limited to desktop applications, and allows for interacting with other Office applications (such as Outlook, Word, or Powerpoint). Because it’s been around for a while, there’s a lot of great documentation and help available. Visual Basic as a language is meant to be English-like and easy to understand.
Be careful running VBA macros you do not trust. Hackers like to use it to distribute malware.
Office Scripts is more modern, can run on desktop and web, and does not have the security concerns of VBA. It uses a language called TypeScript, which is powerful and popular, but more challenging to understand for beginners.
Okay but how do I get started?
Pick a project that you want to automate, and jump in! You can use the Macro Recorder (VBA) or Action Recorder (Office Scripts) to record yourself performing the actions you want to automate. When you are done, code will be generated for you, which you can use as-is, or modify to your specific needs.
StackOverflow is a great resource for finding answers to problems you may encounter, but be warned — they have a reputation for unfriendliness. Search for your questions before asking them, and be sure to follow any submission guidelines.
Take automation a step further with power automate
Power Automate is a third way of automation that doesn’t use very much code at all! Rather, it provides connectors between applications, so you can send an email based on the value in a cell, or schedule a report to be sent via Teams.
What did I miss?
Sound off in the comments if there’s something I missed. Excel is a powerful, complicated behemoth, and I’m sure my 10 levels may look very different than your own.
Disclaimer: at the time of this writing, I am employed by Microsoft, and have worked on Excel and on the Office Scripts team specifically. These opinions are my own, and are not endorsed by my employer